Beta Sensor Configuration
Once you have your Measure the Future Beta Sensor built, it’s time to configure it. Because the sensor measures activity in the field of view of the camera, the better a view the sensor has, the better the data that you’ll end up with. In general, this means the higher and more “overhead” the view, the better. You’re looking for a good clear shot of the space you’re trying to analyze…a good way to think about it is if you were standing and watching, could you identify people and where they are? If you can, the sensor can as well. If your line of sight is blocked, the sensor will also miss that area.
The second thing to consider is light levels. Again, in general, the more stable the light, the better the sensor will do in capturing the activity in the area. If there are huge swings in the light level of an area through the day, it may affect the “people counting” nature of the sensor, although the aggregate activity data will likely still be extremely useful. In the settings panel of the sensor, there are a few settings that can be tweaked to reduce this effect.
When you plug your Measure the Future Sensor in, the sensor will generate its own wifi signal, named whatever you specified when you built the sensor. You can connect directly to the sensor using wifi and the password you set from any device with a browser…a laptop is probably most convenient.
Once you’re connected, launch a browser and go to http://10.0.0.1 and you should see a screen that looks like this
This is an uncalibrated, non-active Sensor. You can edit the “Location” name if you wish by selecting “edit” and saving the change. The settings panel looks like this:

You can leave all of those settings at their defaults for the time being, although if you have issues with accurate measurement of your space, it may be necessary to tweak the settings some for optimal data collection.
If your sensor is in place and ready to begin measuring, you should click the “Activate” button. That will create a fresh database for your data, and “reset” the sensor to prepare it to start measuring. Once you do, the page should look like this:
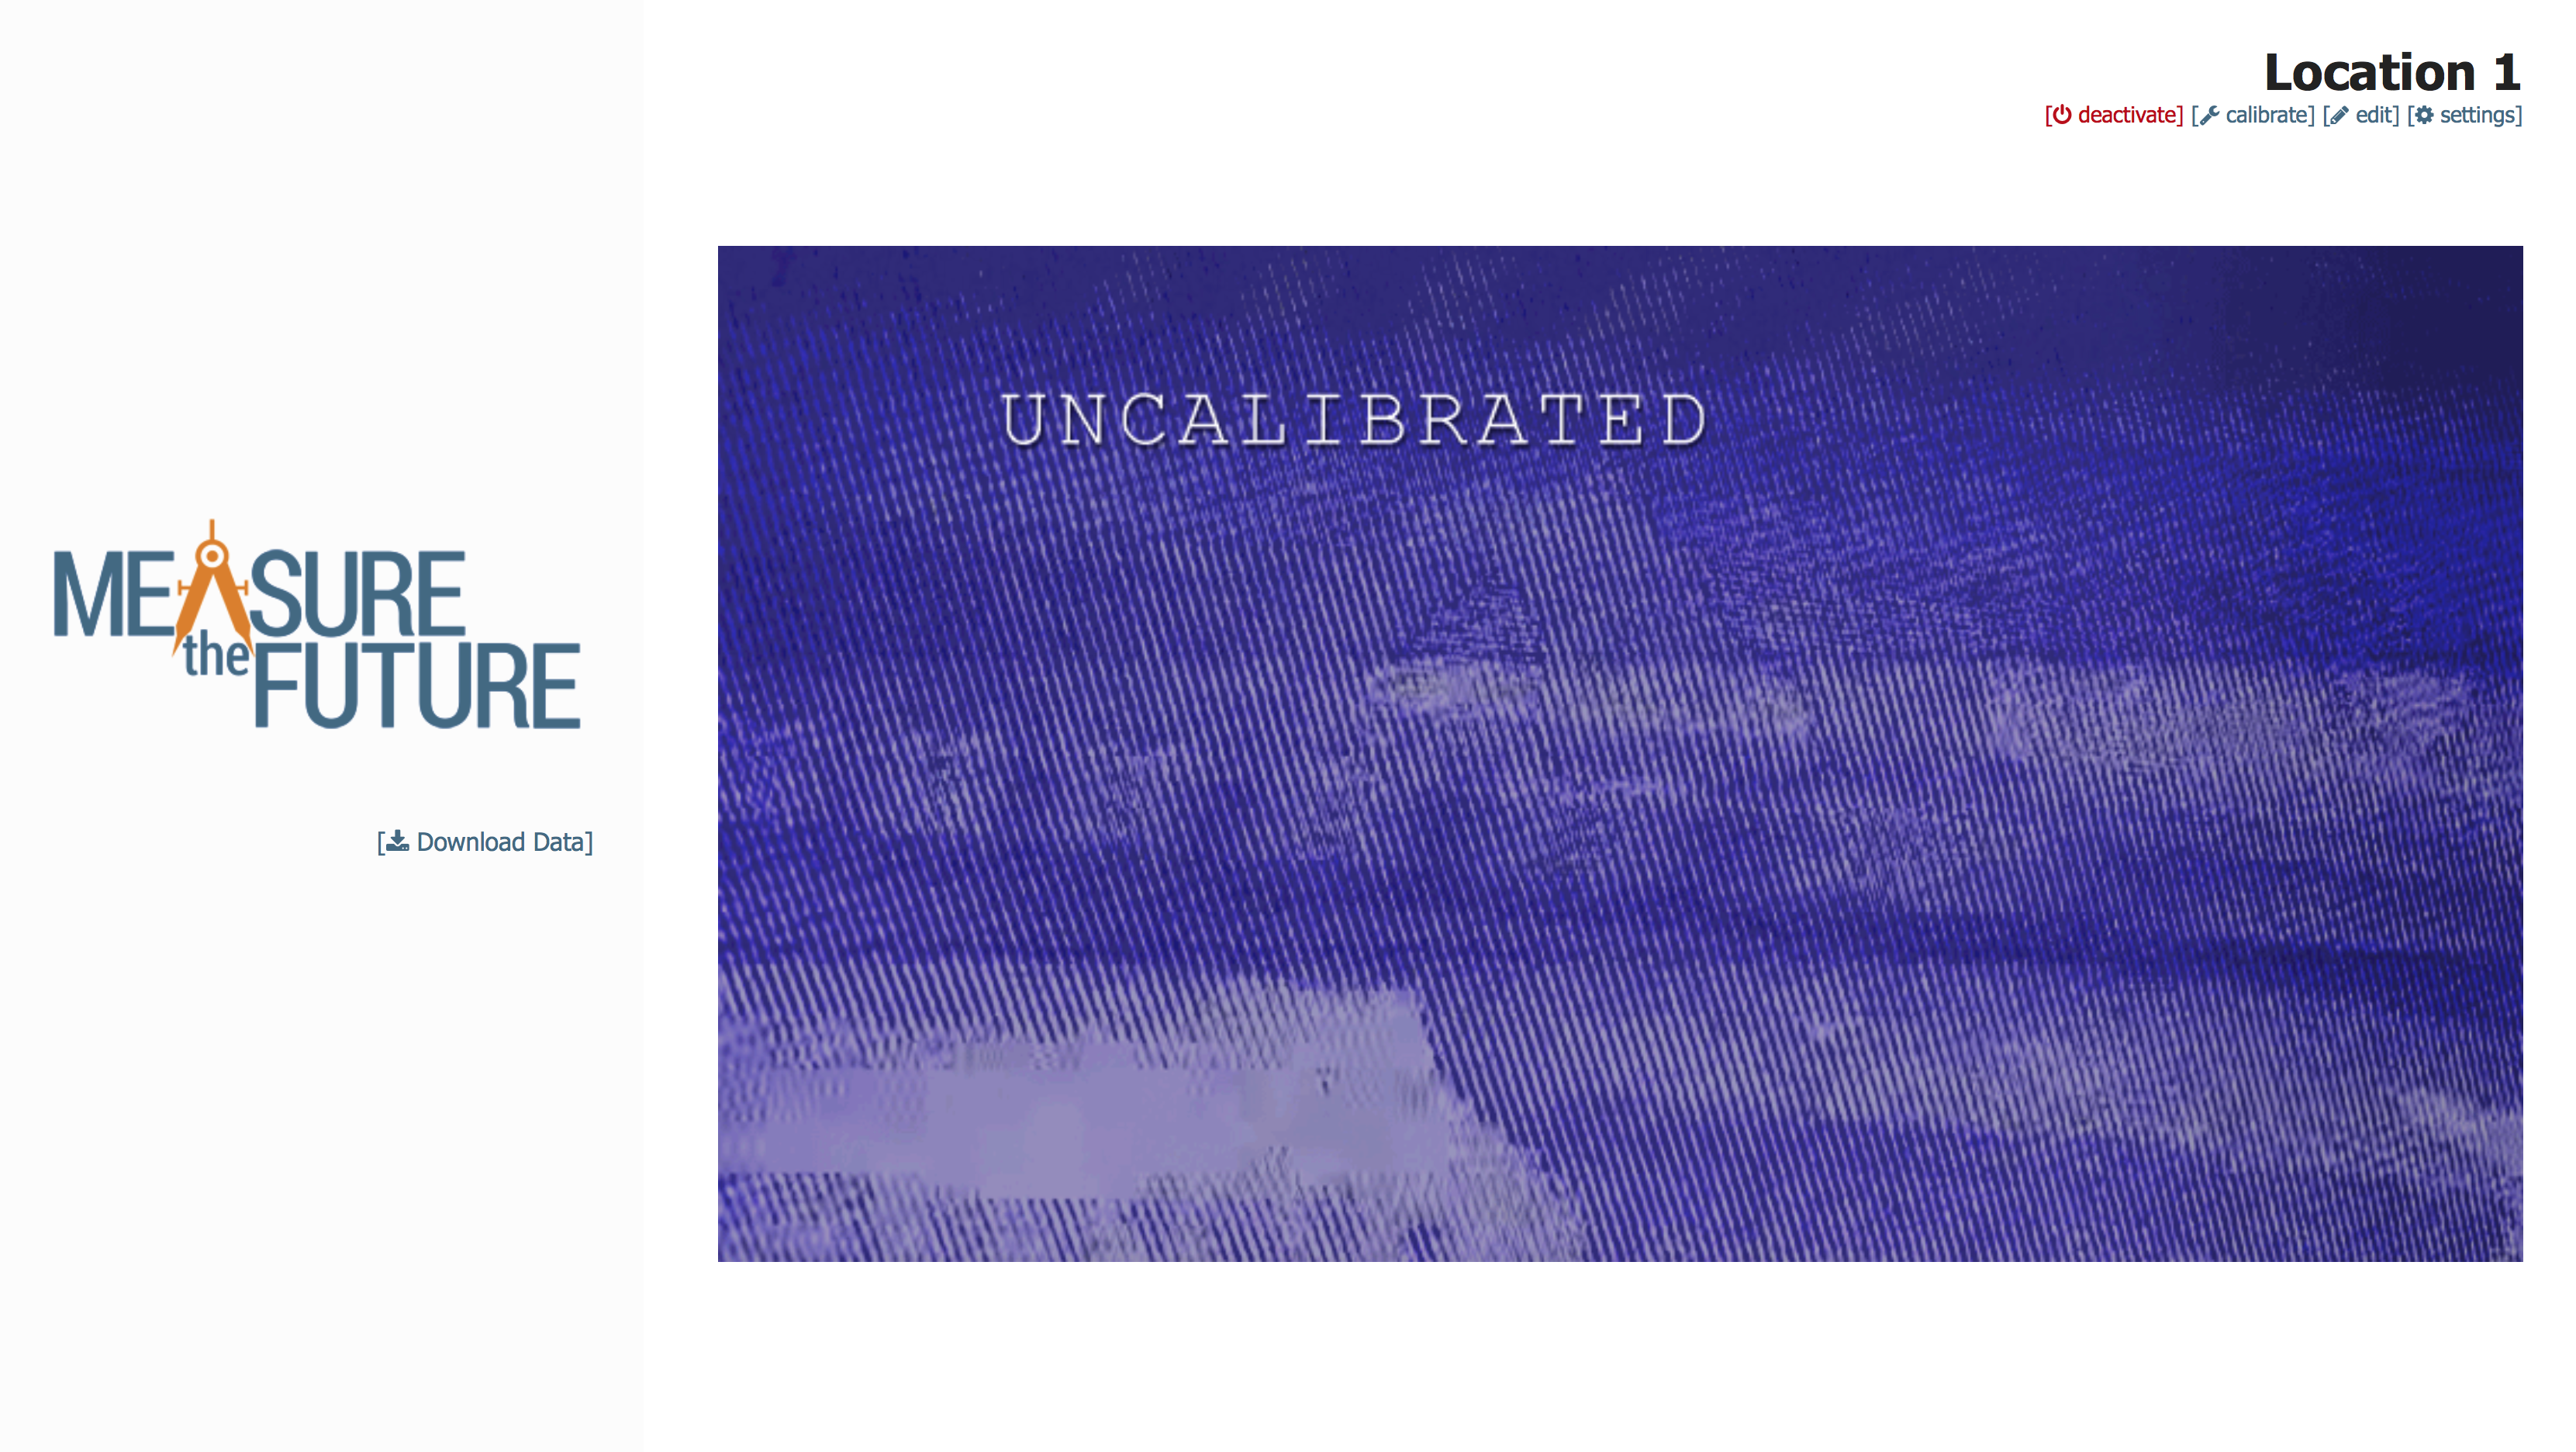
There is a new option in the menu, “Calibrate”. This takes the reference picture for the space, ensures that you’re measuring the space you wish to measure, and is the photo that subsequent movement will be plotted against. It’s very important to get a good initial calibration image, and to NOT move the sensor once you have it in place. Once you click calibrate, you should see something like:
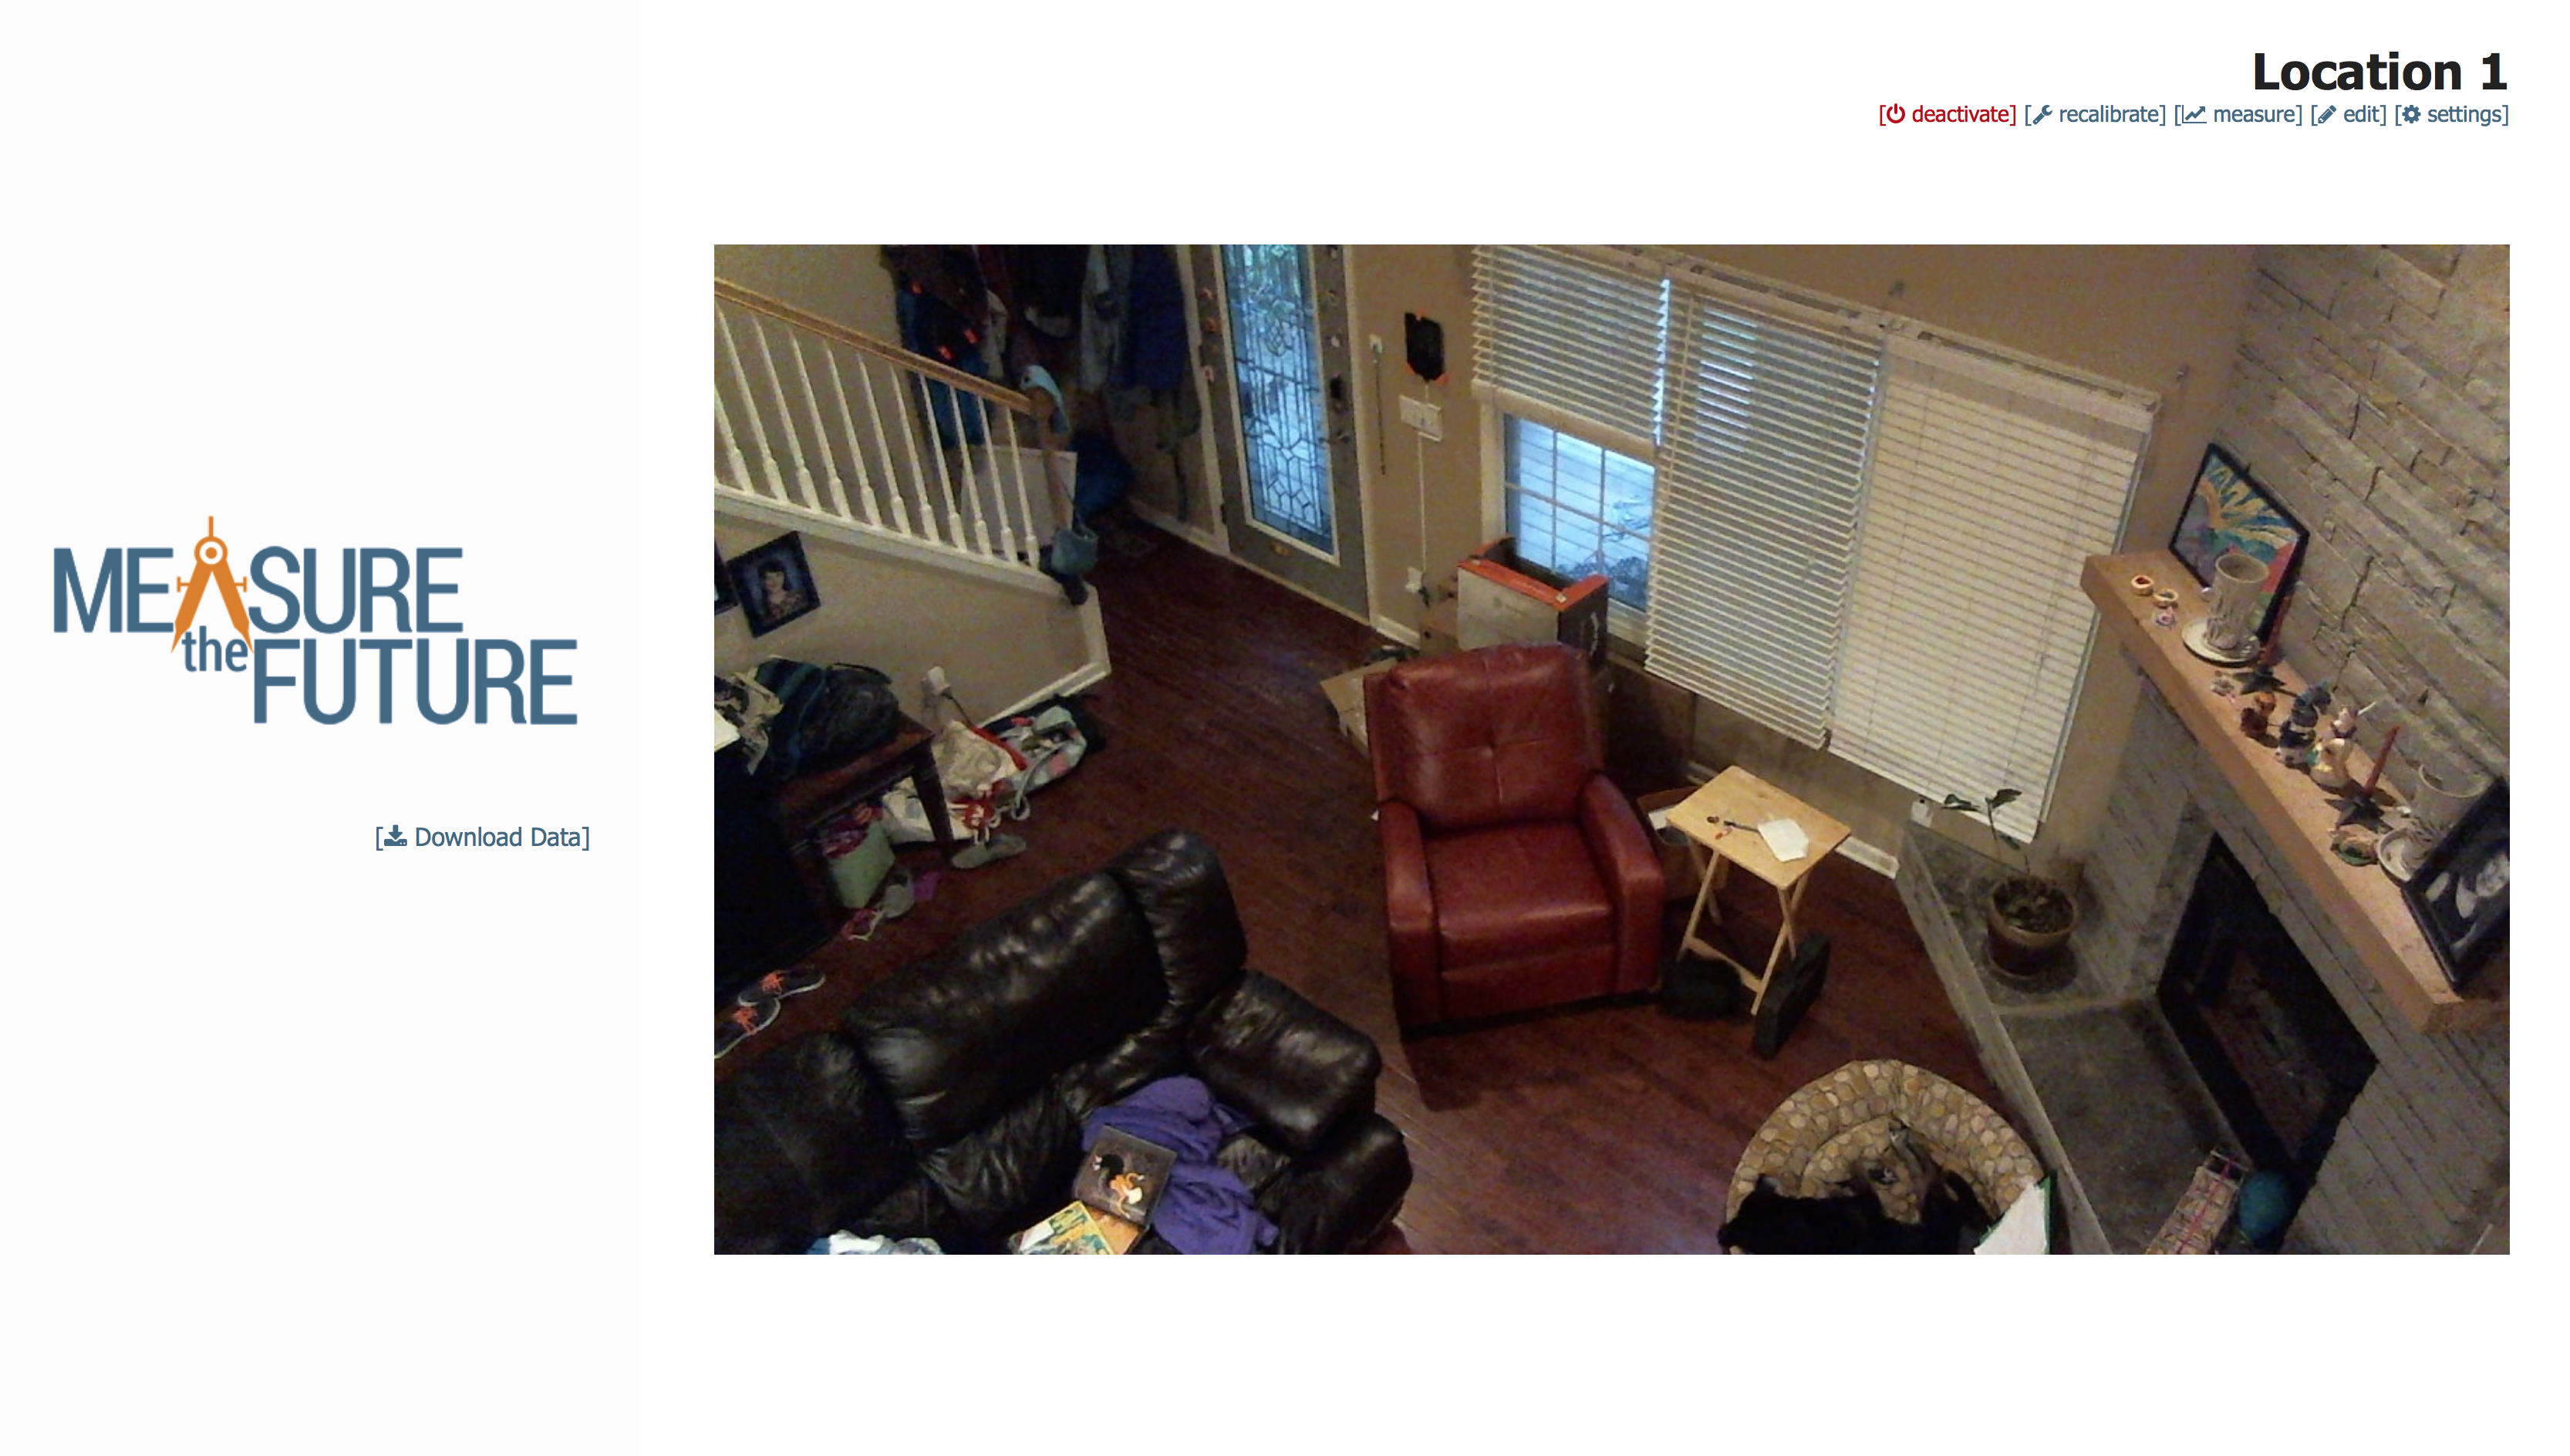
If the image isn’t quite right, now is the time to move the sensor or change the camera angle, then hit “recalibrate”. That will re-take that calibration image, and bring you back to this page with the new photo. Once you’ve got the image dialed in the way you’d like, hit “Measure”. That starts the data collection process, and begins the system drawing it’s rough heat map of your space. For example, the above image becomes:
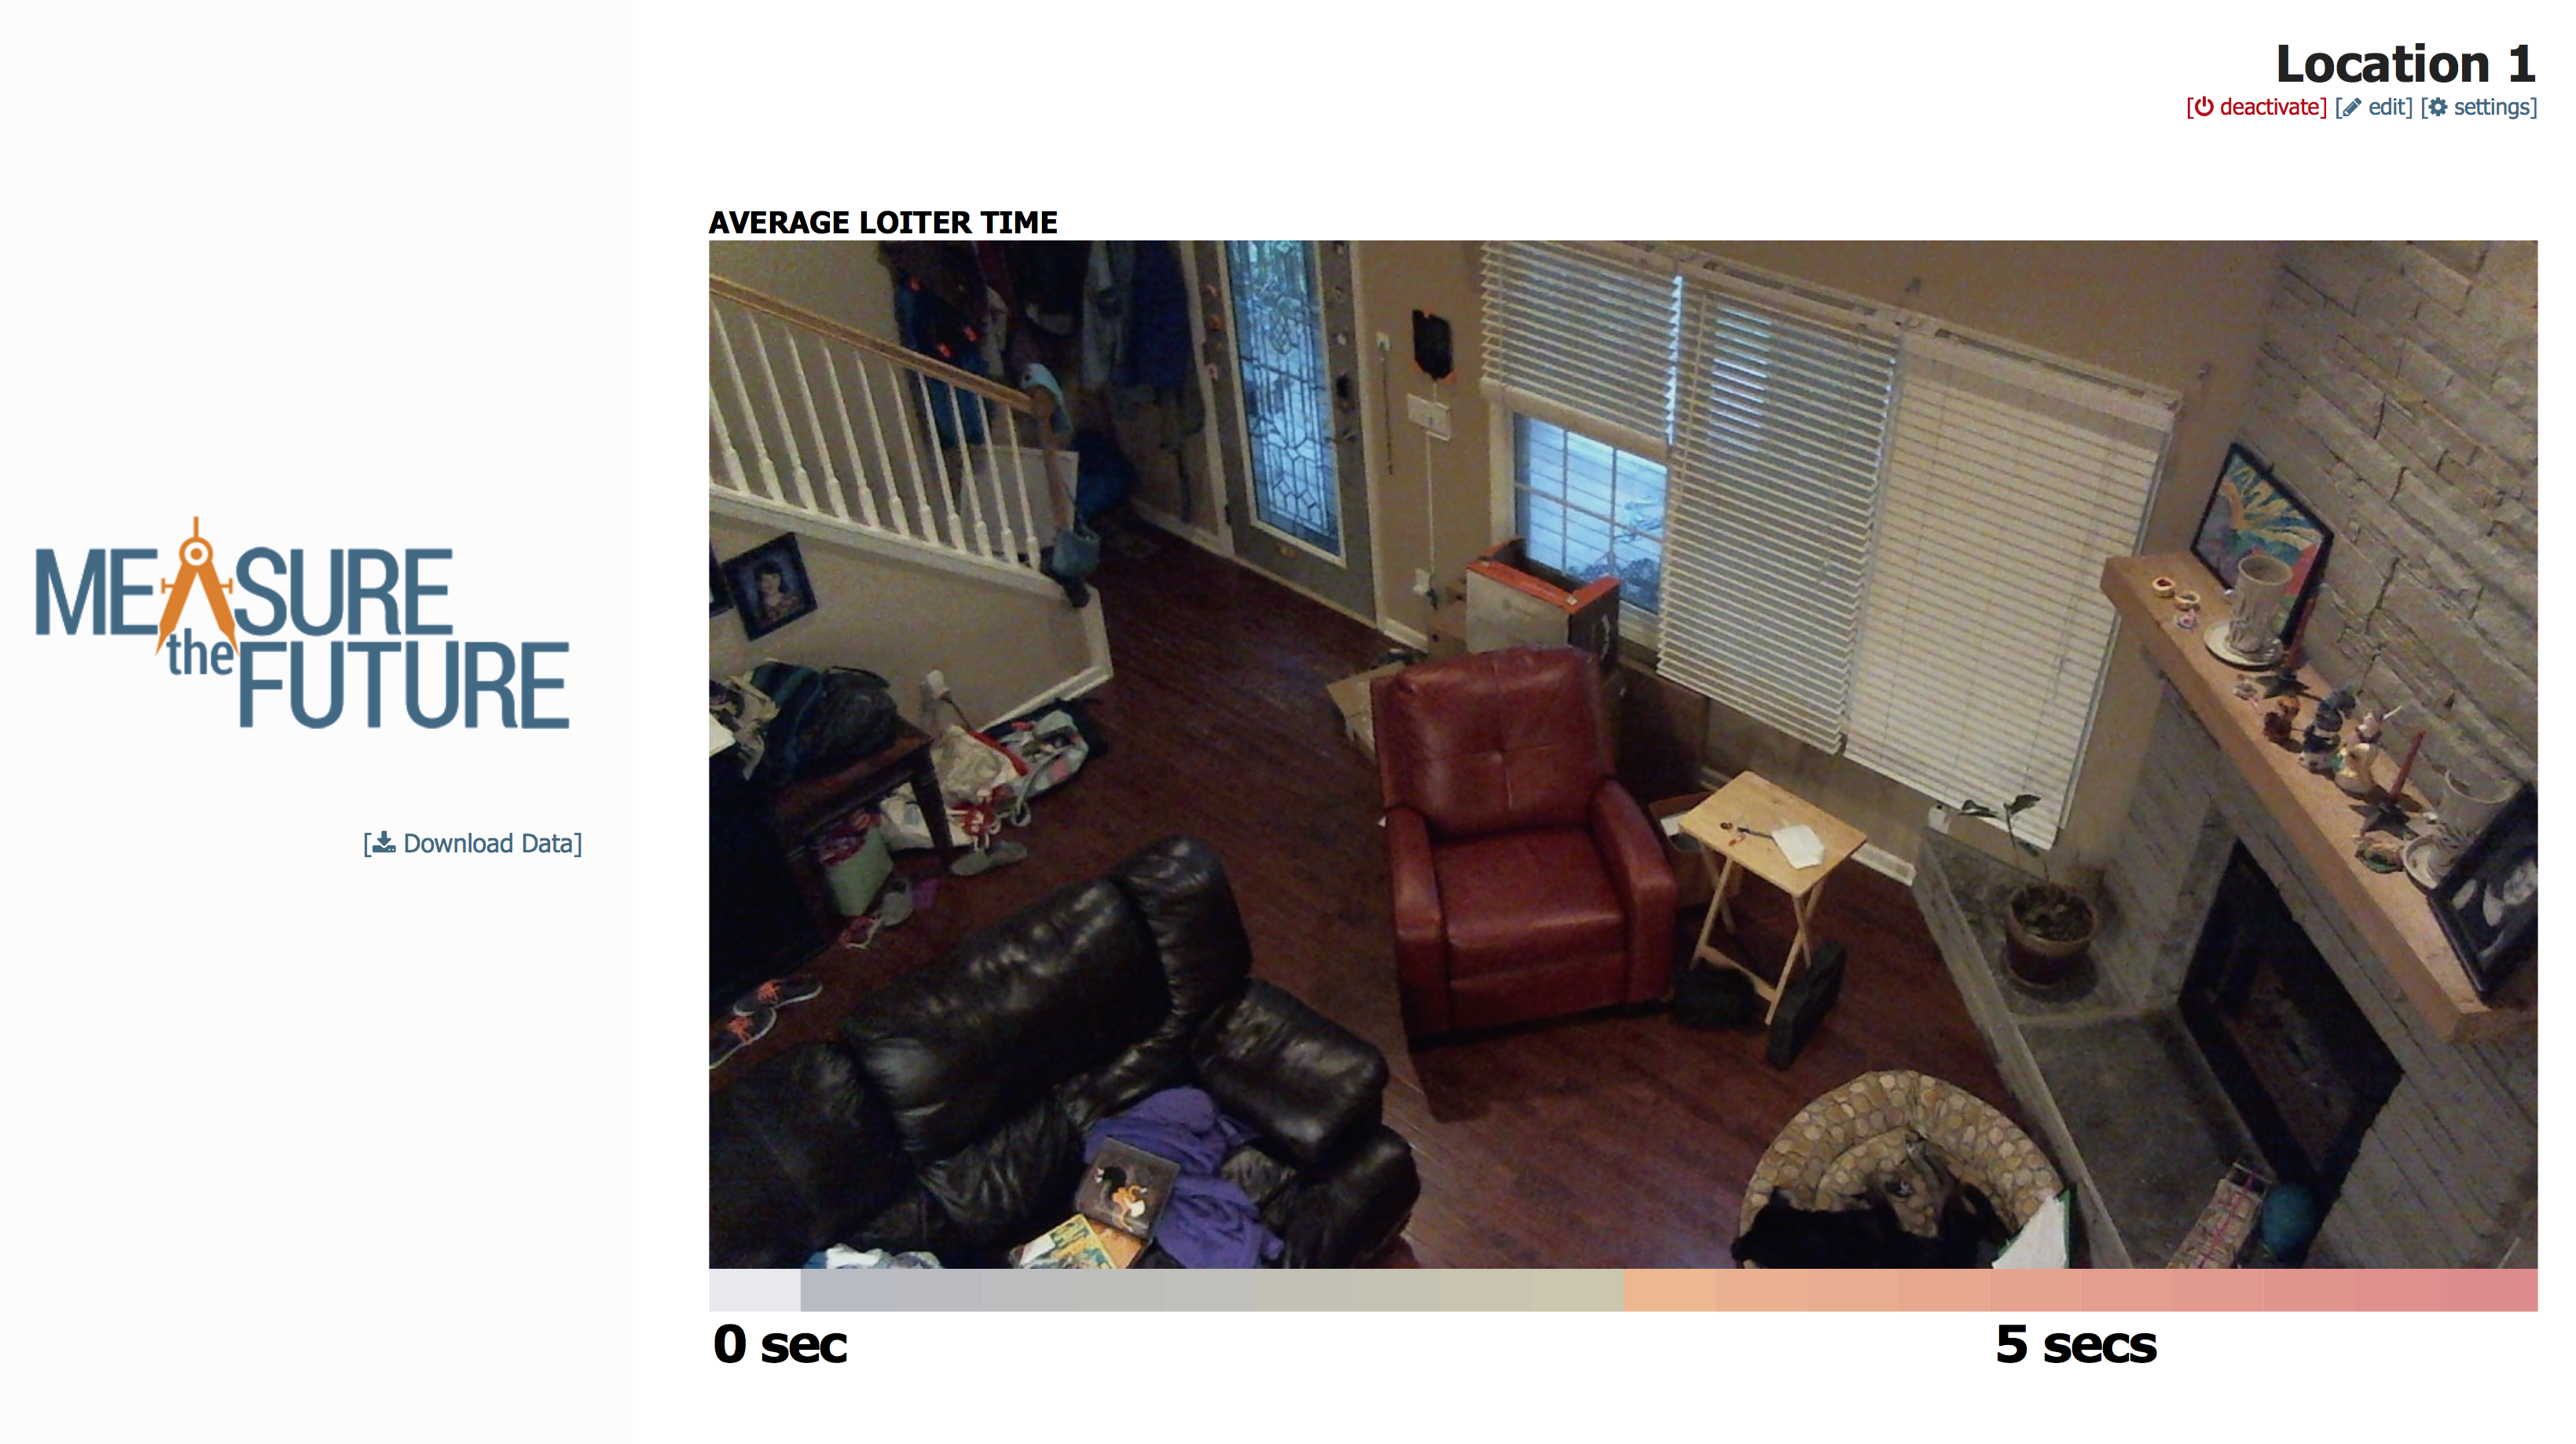
And then, over time, it becomes:
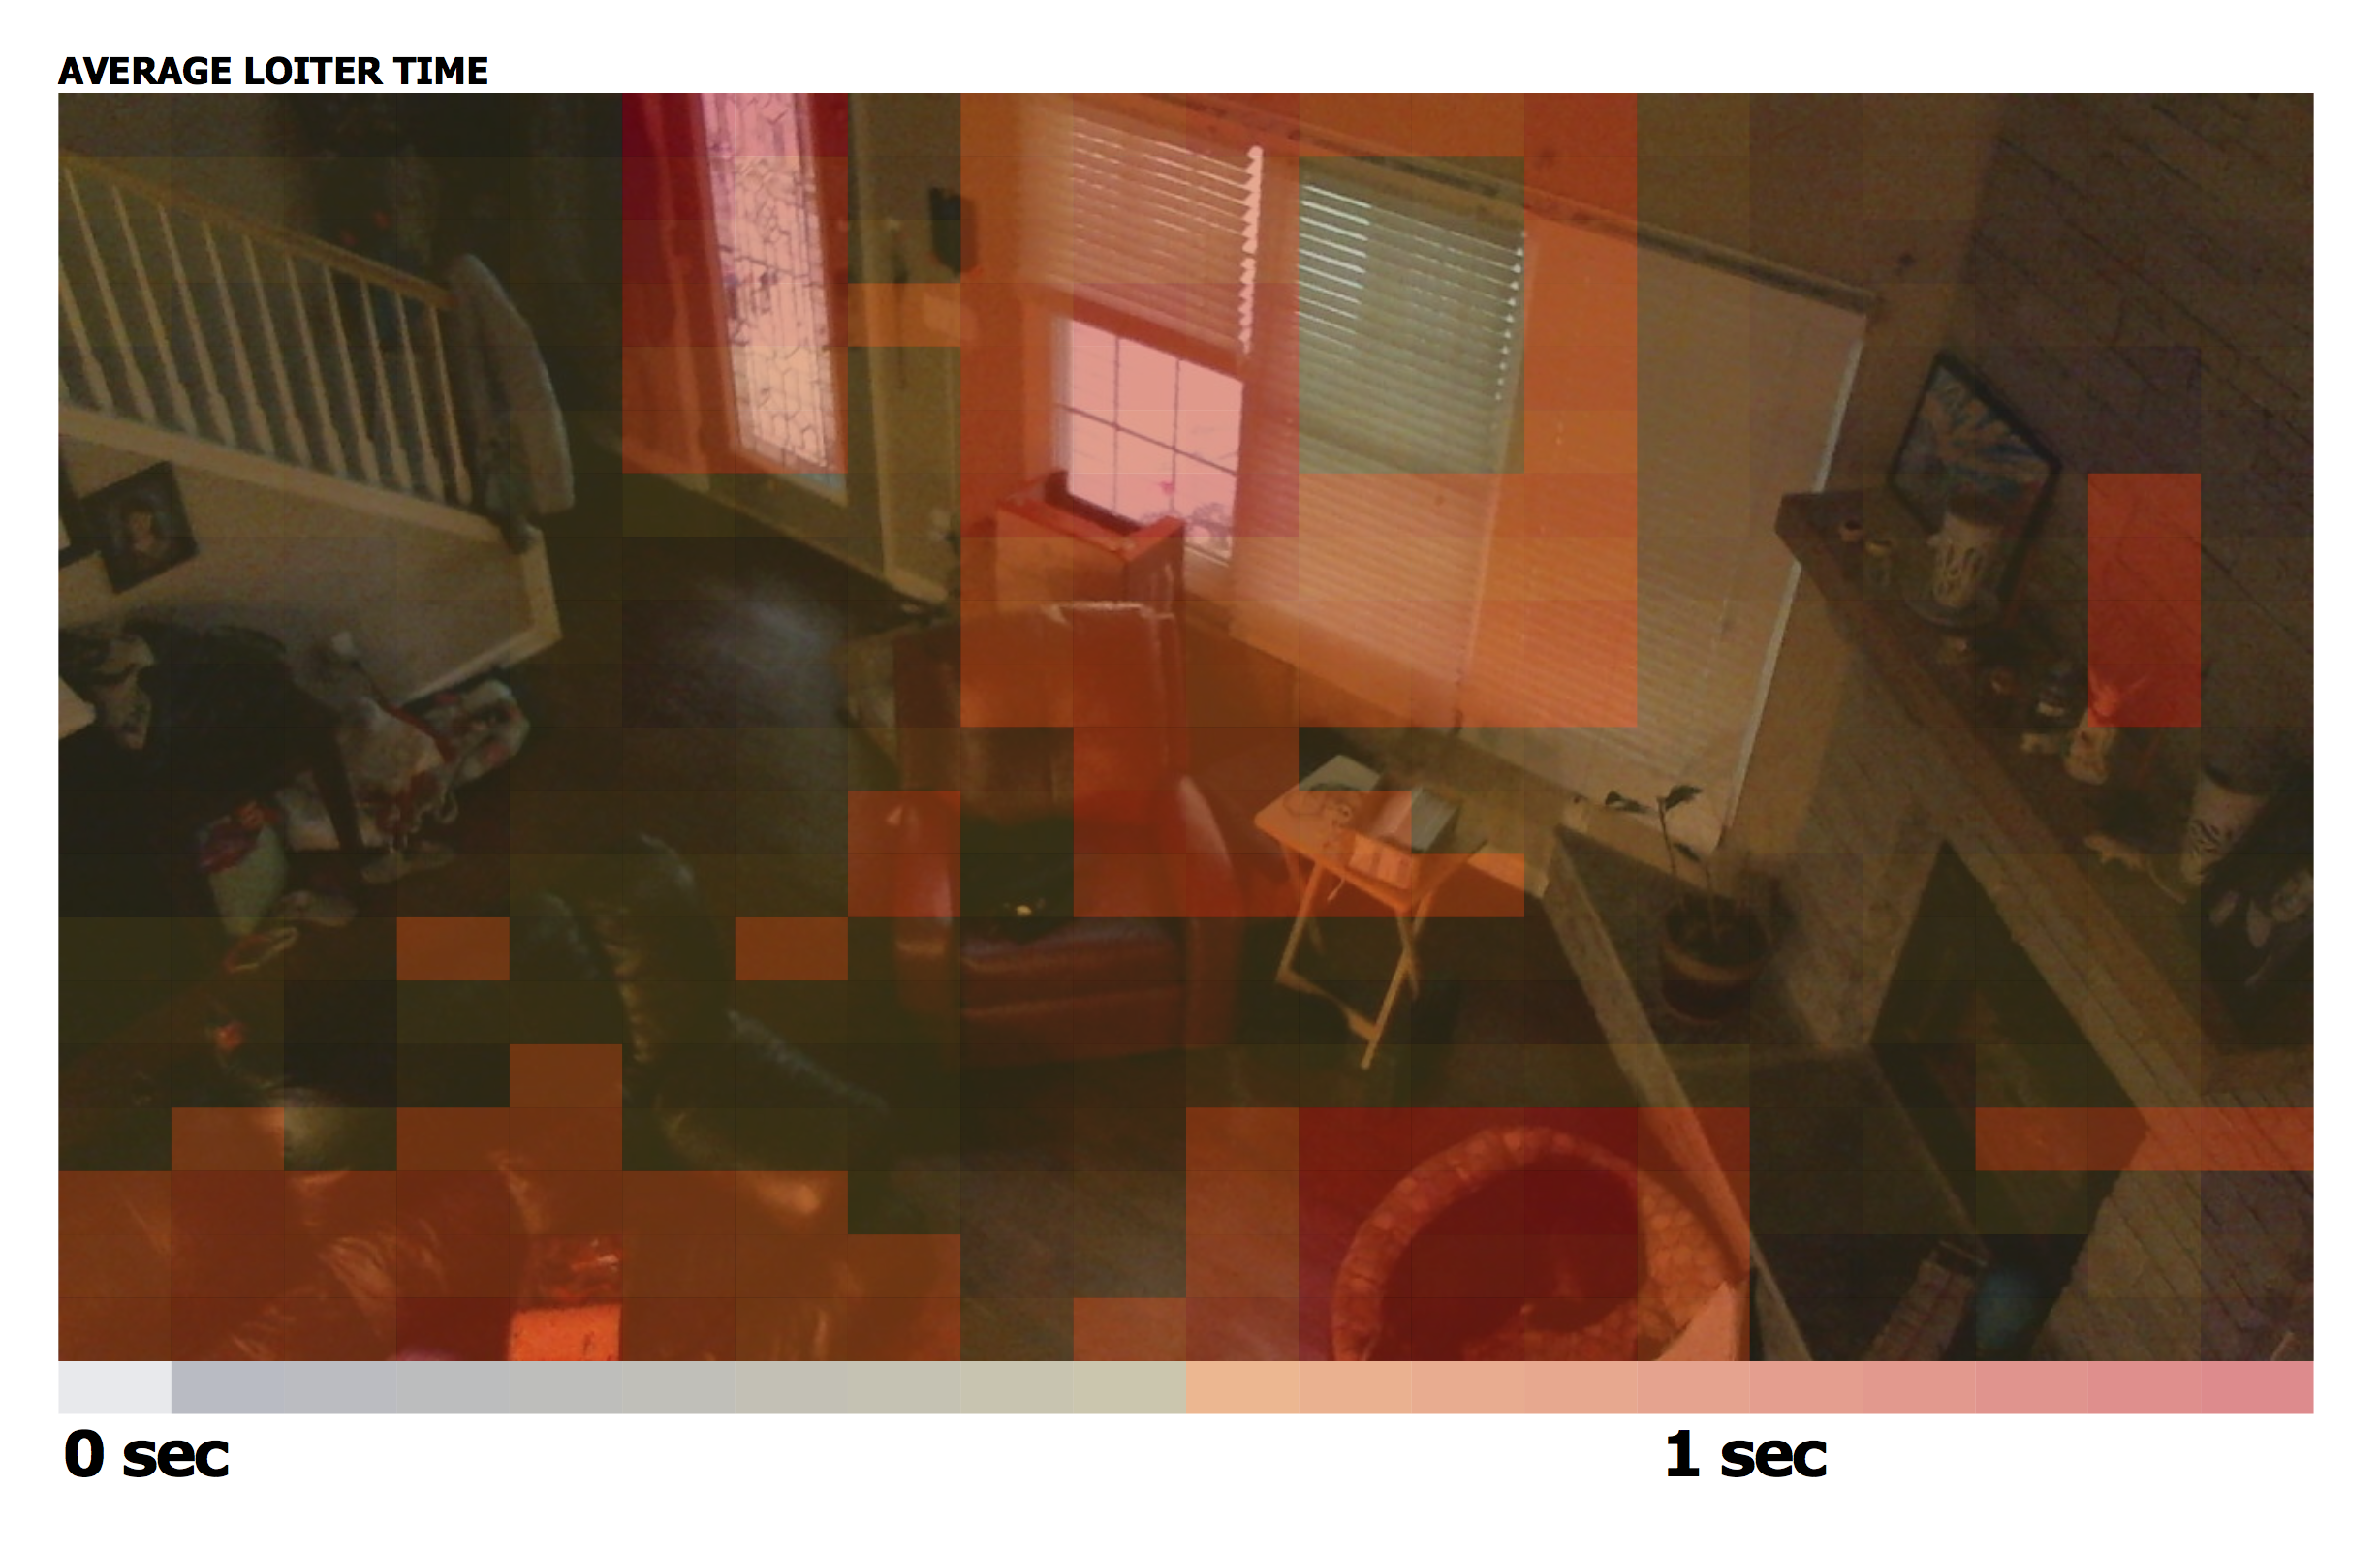
The heat maps on the sensor itself are rough, just due to the processing limitations of the Raspberry Pi. They will get more detailed as we tweak the software, but the data itself exists to do very detailed heatmaps, at a pixel-level, like the below from New York Public Library:
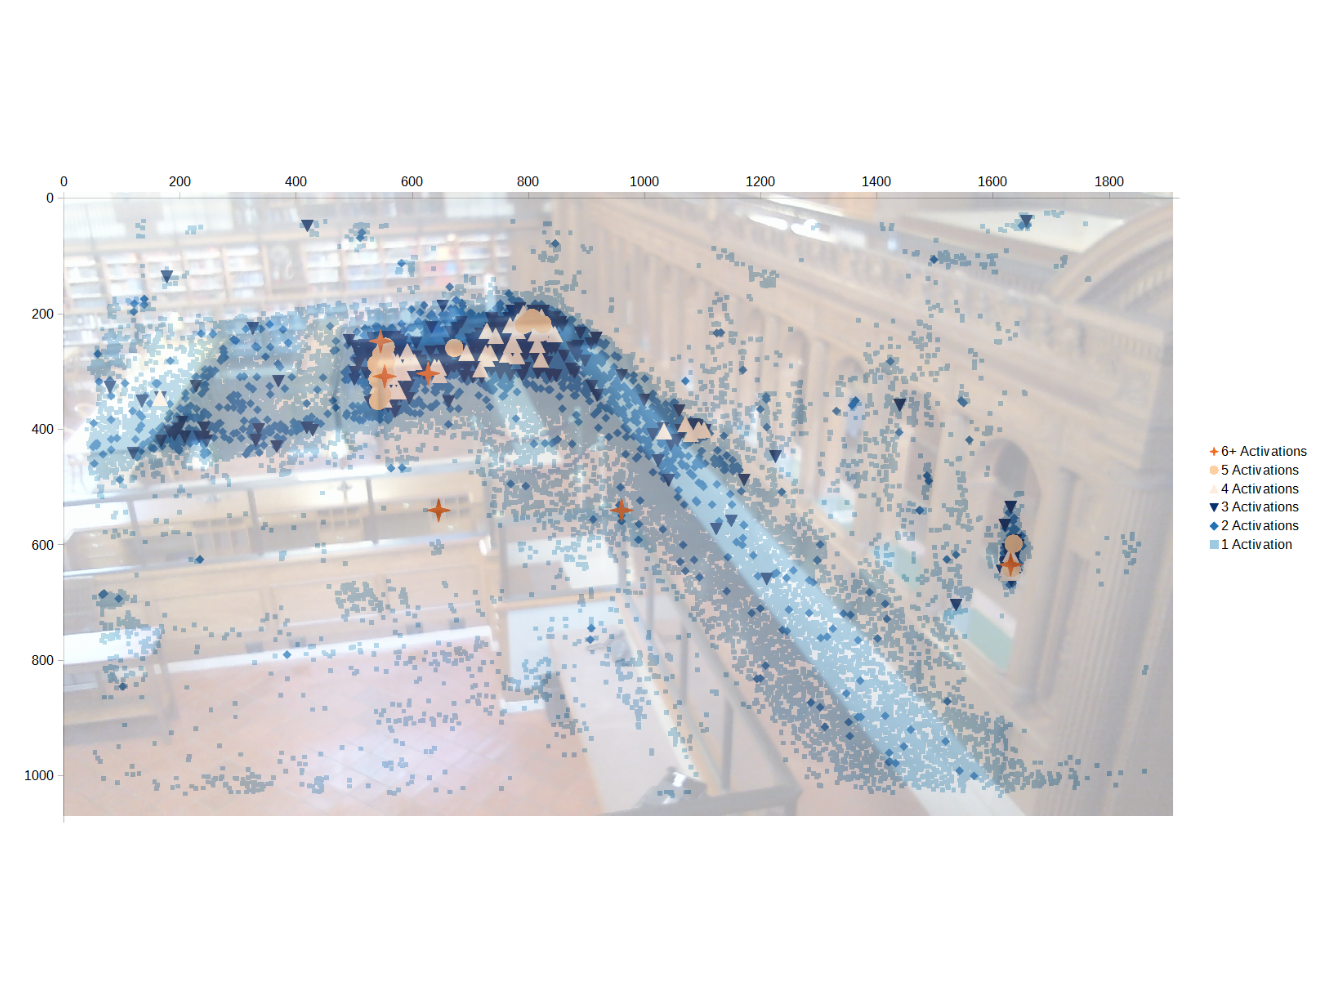
That more detailed data is available by click the “Download Data” button, which will download to your computer a ZIP file of all interactions on the system to that point in time, saved as a JSON file along with sensor health information, the original “calibration” image that the points are plotted against, and more.
The sensor will continue to save data as long as it is on. With the current installation, because everything is being saved locally, it is a suggested best practice to download the data weekly, and reset/recalibrate the sensor monthly until you’re comfortable with the data being collected. These steps won’t be necessary as we move through the rest of the Beta period and move the data collection to the cloud.